When reporting an issue to our Customer Support team, we may request a screen recording or screenshot of your web browser's Console and/or Network logs to thoroughly troubleshoot the problem. These details are crucial for identifying the root cause of the issue or bug you're encountering. In this article, we will guide you on how to use debugging tools to report issues to us.
In this article
A. Utilizing Jam Dev for screen recording
B. Accessing your browser's developer console and network logs
A. Utilizing Jam Dev for screen recording
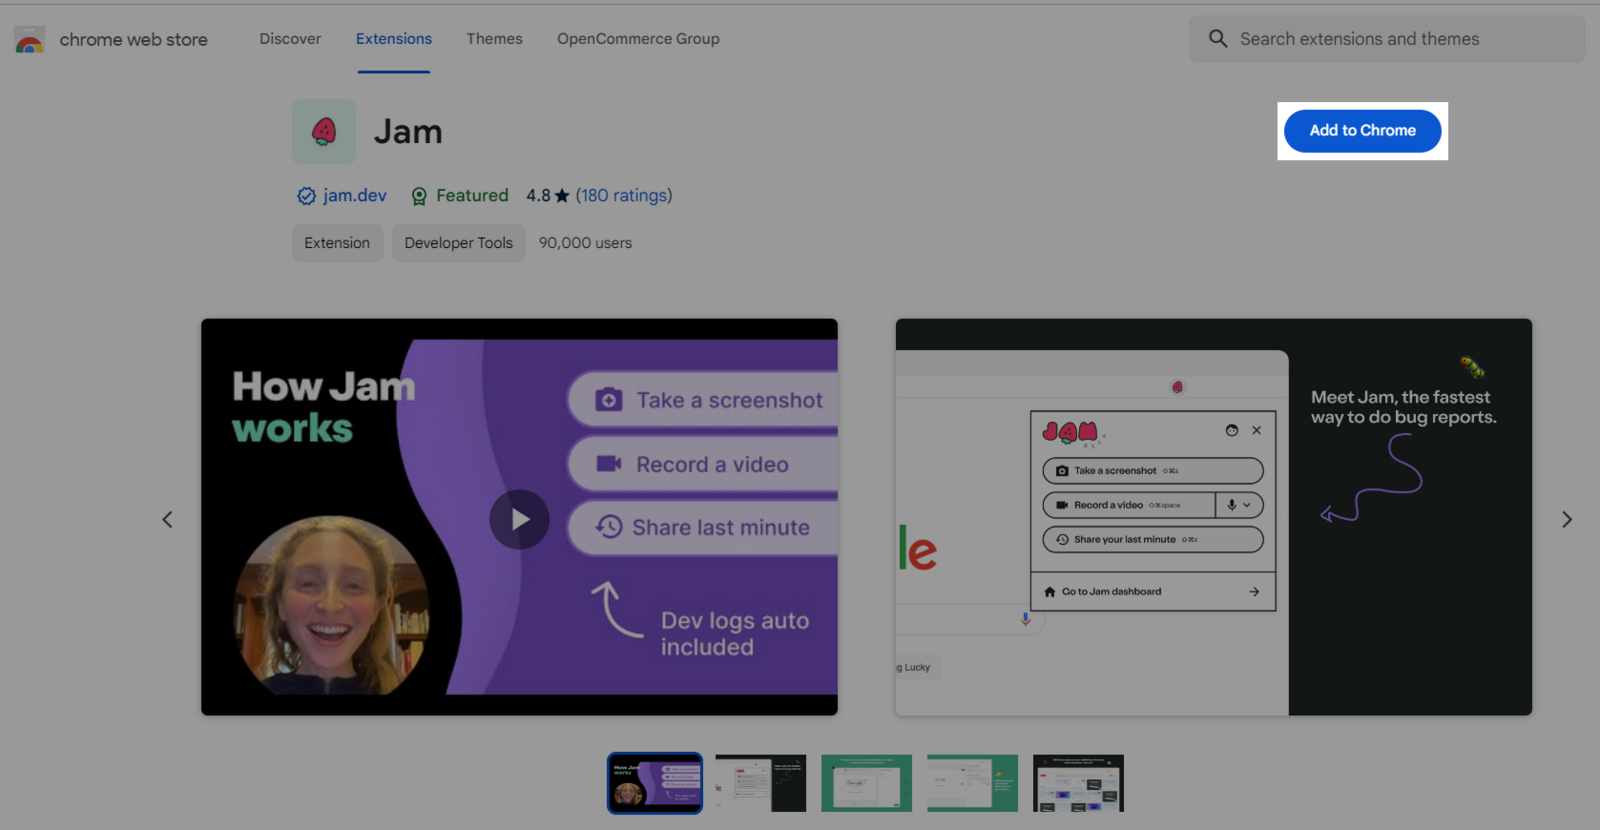
Navigate to the page where the issue occurs.
Open the Jam extension. Click on the Record tab button to start screen recording.
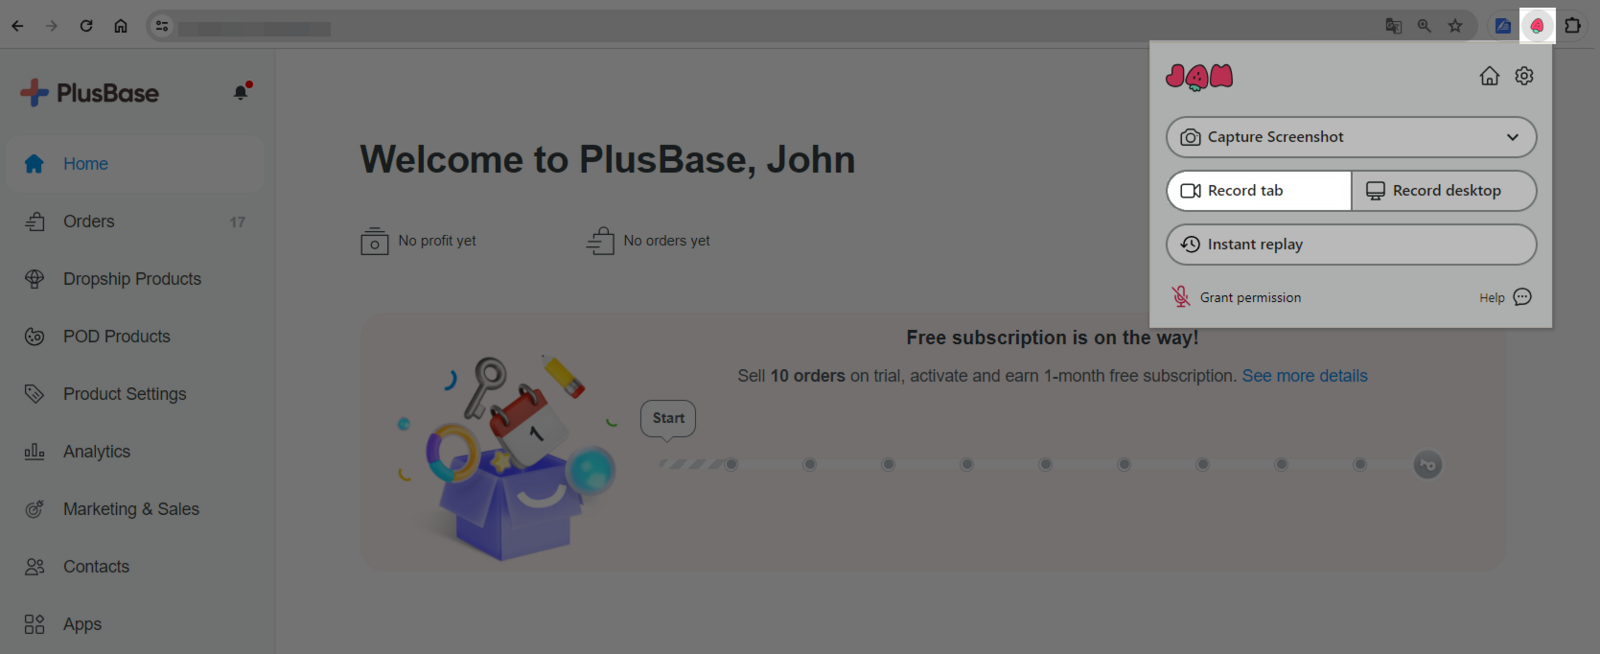
Perform the actions that lead to the bug or issue you're experiencing.
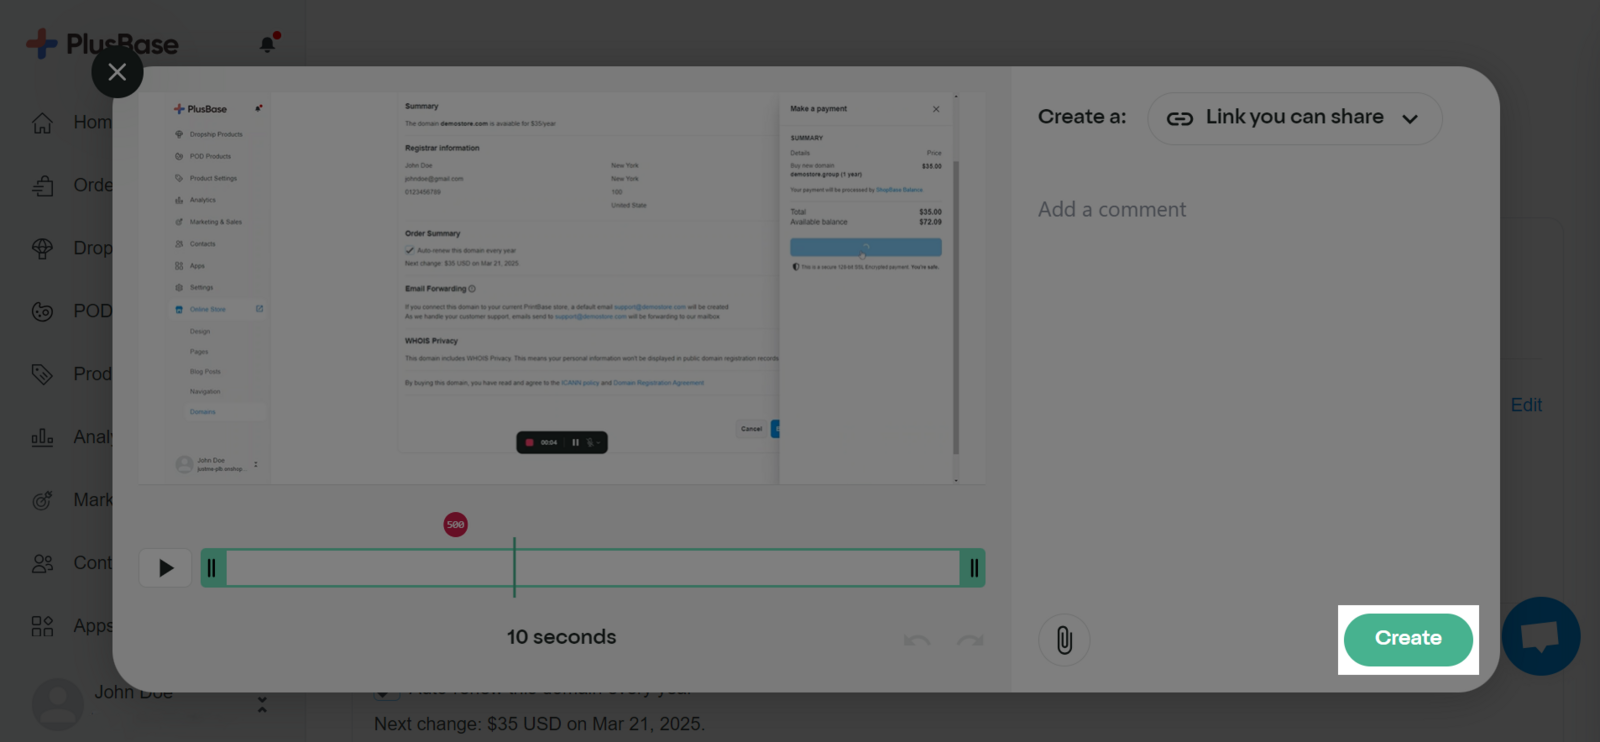
Finish your recording, click the Create button.
Then, copy the video link and send it to our customer support team for further assistance.
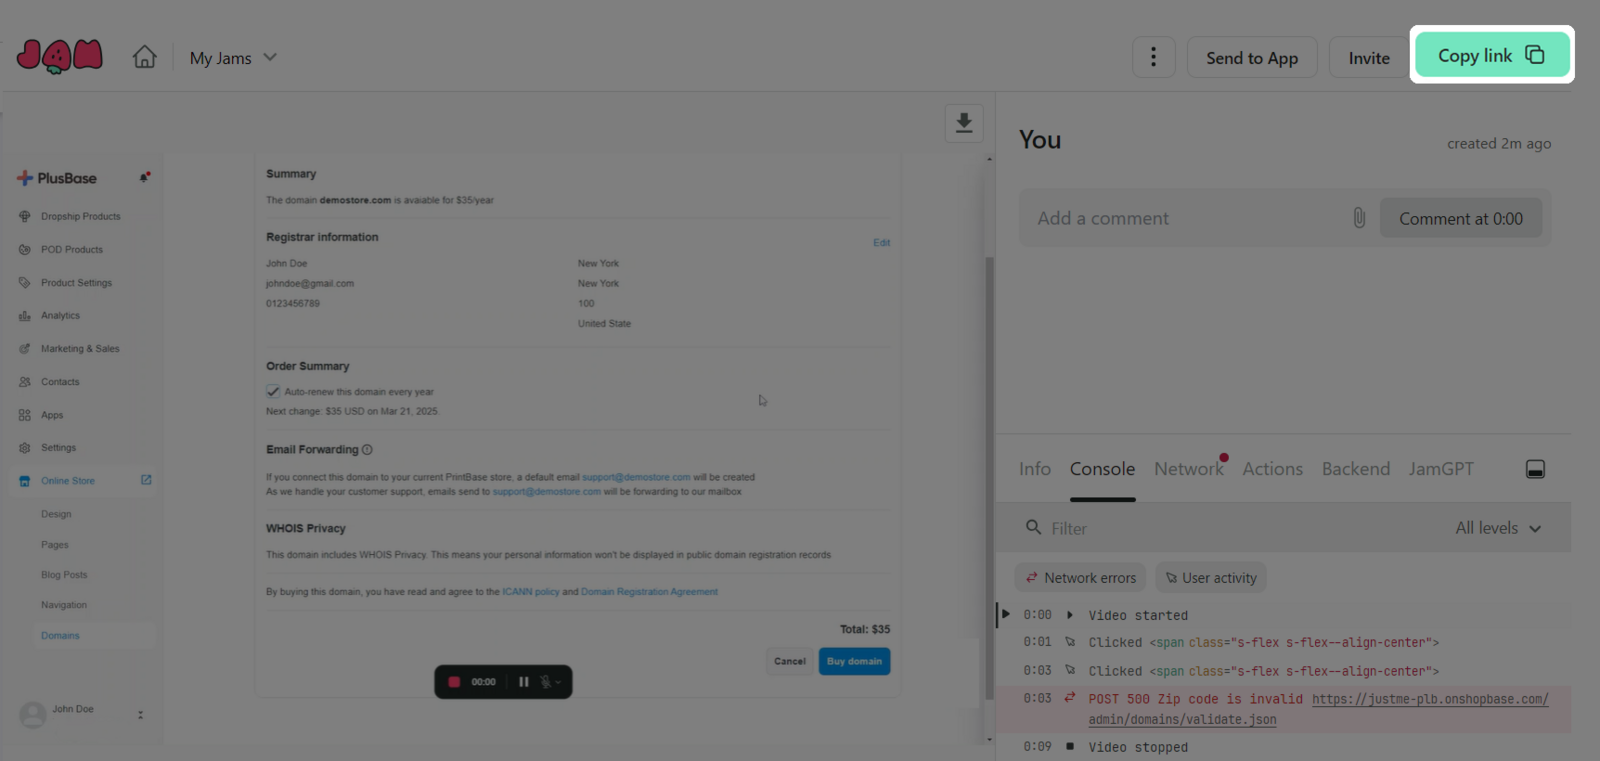
You can review the details in the video provided here.
When you record a video of your screen with Jam, it captures the technical diagnostics automatically and includes them to assist our debugging process, making it faster and more effective.
B. Accessing your browser's developer console and network logs
Apple Safari
In Safari Browser, console and network logs are available as a part of Developer Menu.
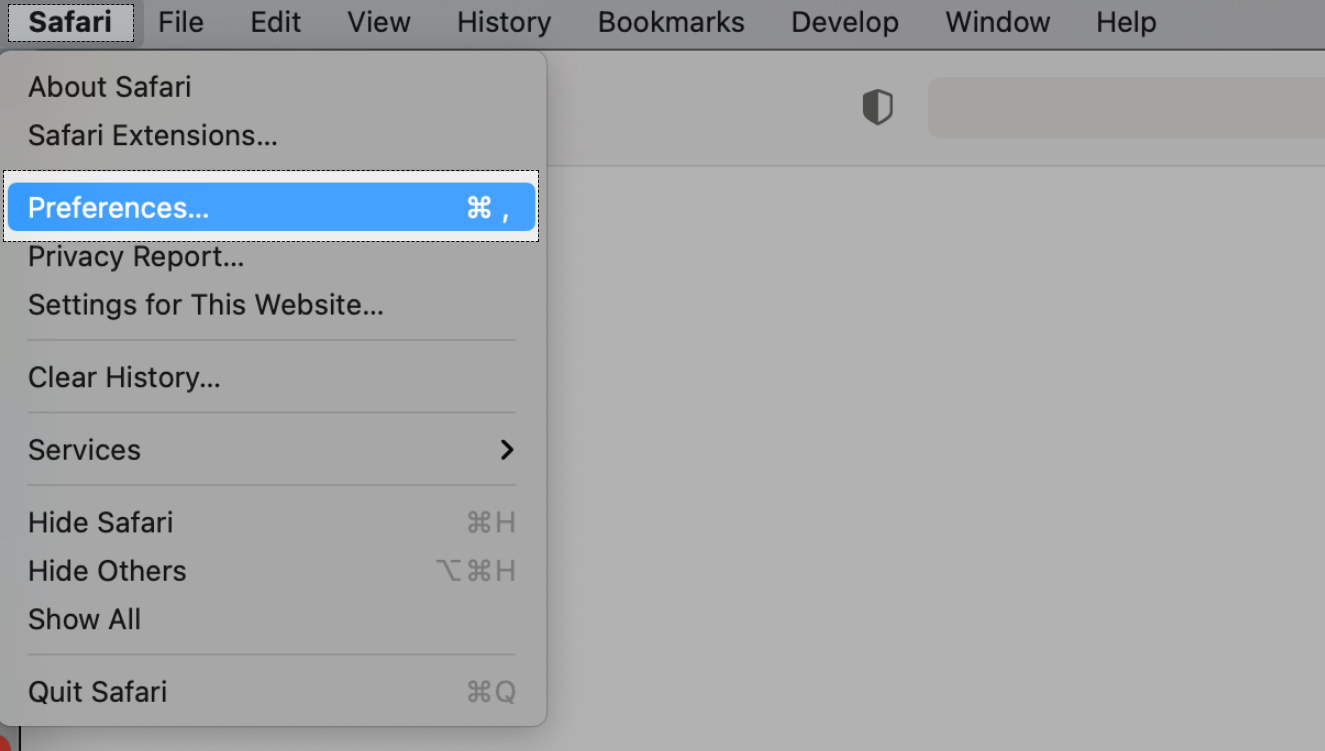
To enable the Developer Menu in Safari, go to Safari Menu > Preferences.
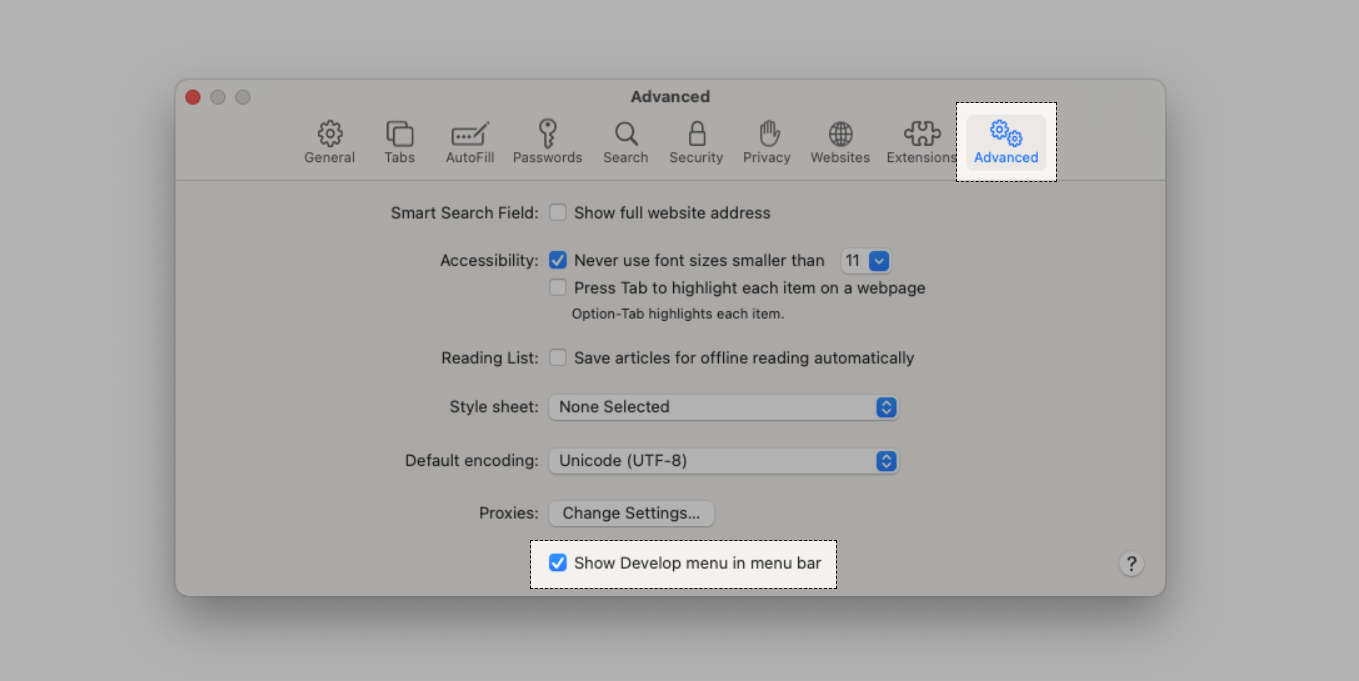
In the Advanced Tab, tick Show develop menu in menu bar.
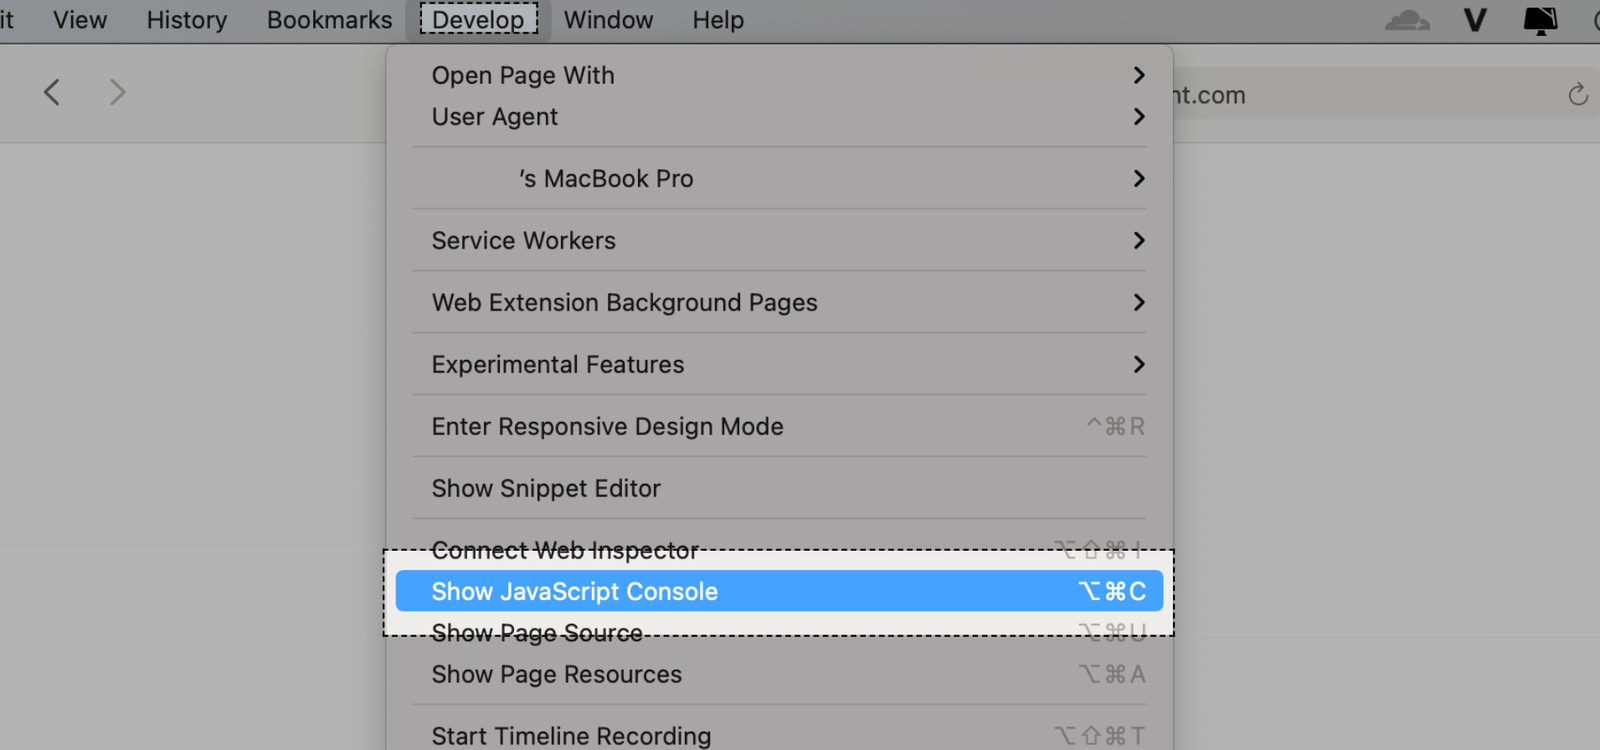
Once this function is enabled, go to the desired webpage and find the developer console by clicking on Develop > Show Javascript Console, or use shortcut Option + ⌘ + C.
The console will either open up within your current Safari window, or in a new window. The Console tab will be selected automatically. Here, you can find the current error messages (displayed in red) along with other console level information such as warnings and info.
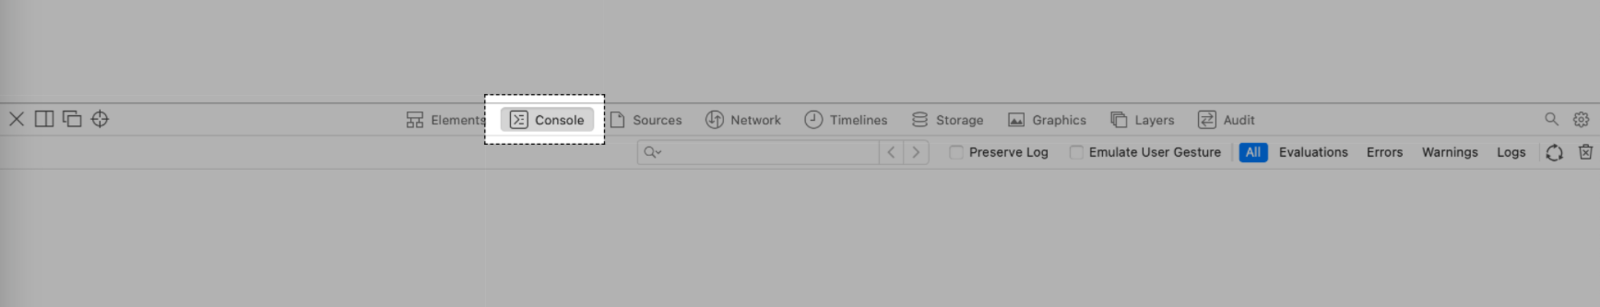
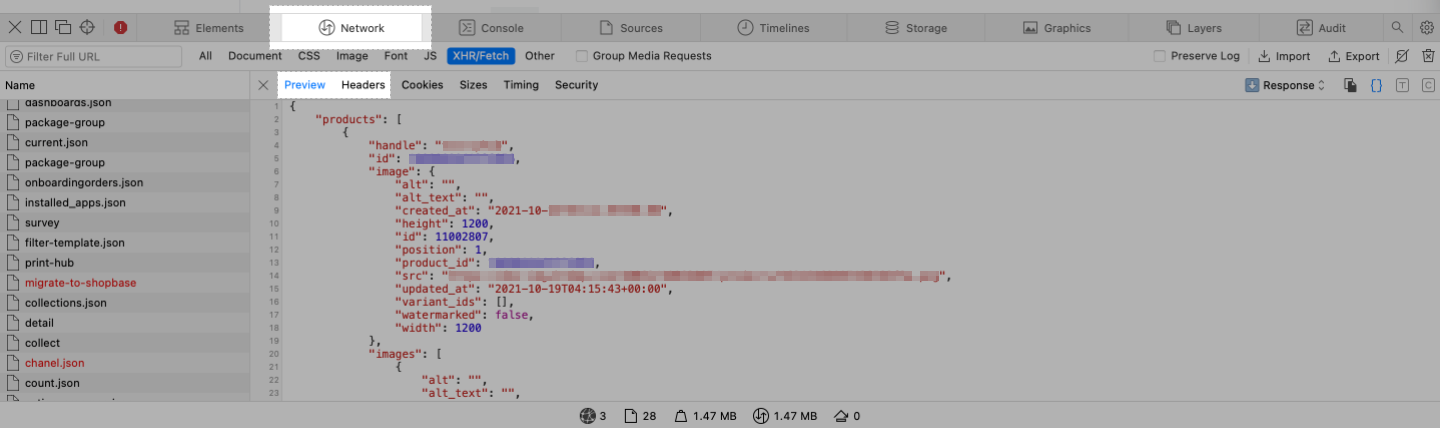
To open the Network logs, switch to Network tab and refresh the webpage. Errors are displayed in red.
Click on the error to open the details. You can find critical error information in Preview and Headers tab. Please check with your designated support agent to determine which information to share.
Google Chrome
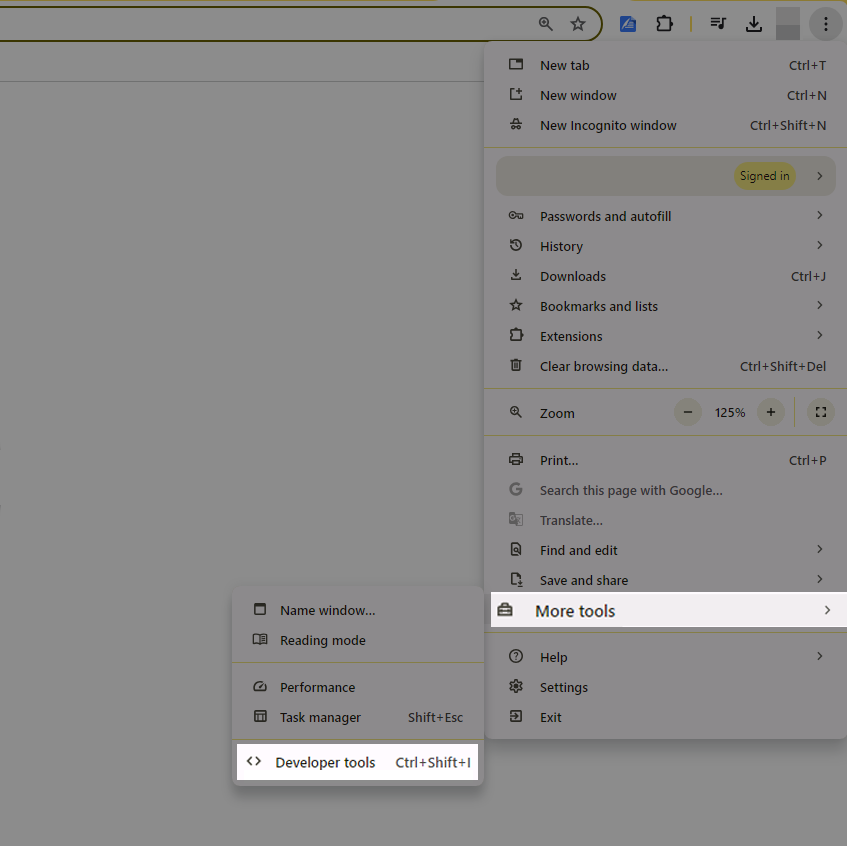
In Google Chrome, open Chrome Menu in the upper-right corner of the browser window and select More Tools > Developer Tools. You can also use shortcut Option + ⌘ + J (on macOS), or CTRL + Shift + I (on Windows/Linux).
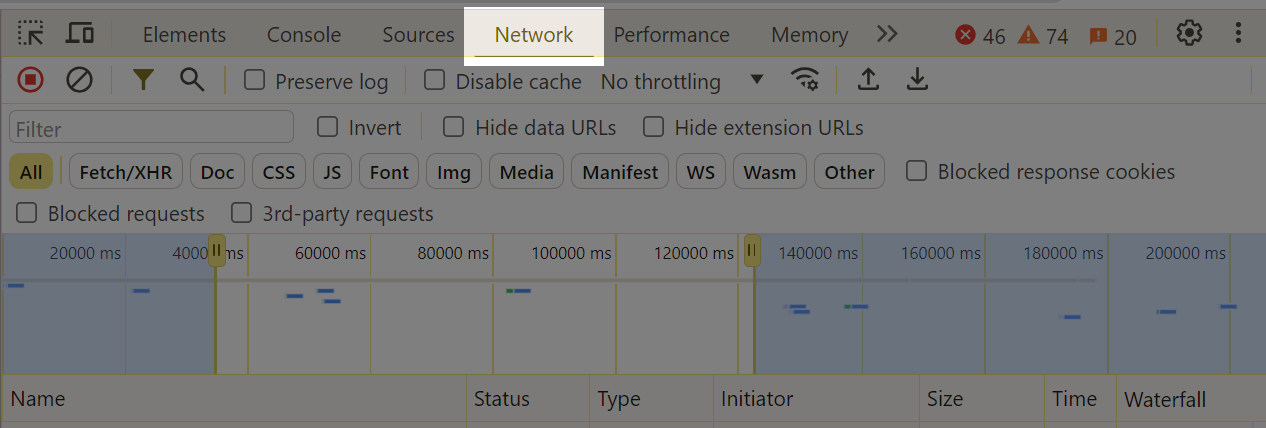
Select Network tab and refresh the webpage, perform the actions that lead to the bug or issue you're experiencing. Errors are displayed in red.
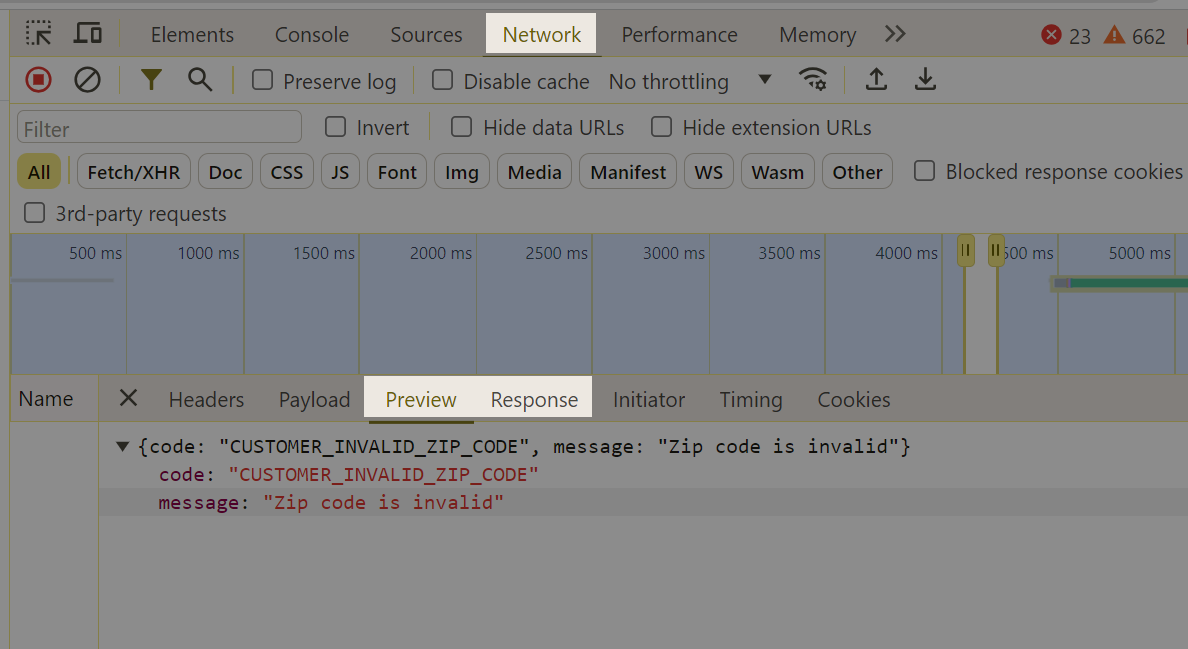
Click on the error to find the error details. Navigate across Preview and Response tabs to know more about the error and its origin. Please check with your designated support agent to determine which information to share.
Mozilla Firefox
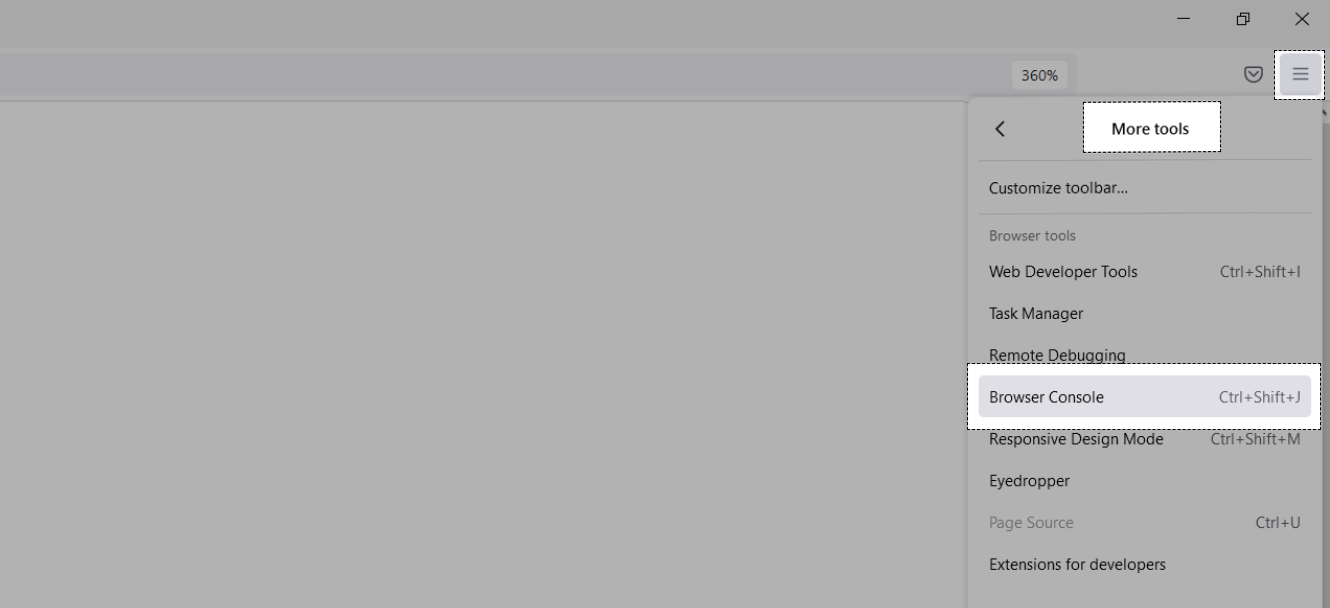
In Firefox, open Firefox Menu in the upper-right-hand corner of the browser and select More Tools > Browser Console. You can also use shortcut Shift + ⌘ + J (on macOS), or CTRL + Shift + J (on Windows/Linux).
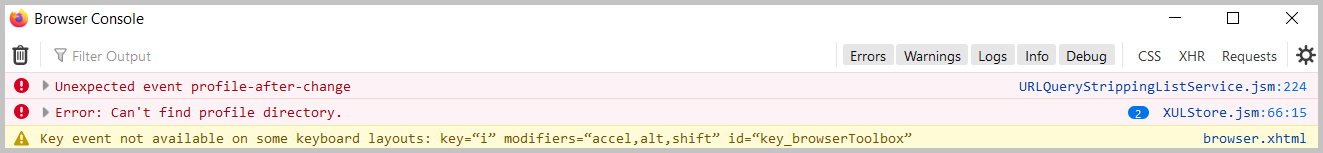
The Browser console will open up within your current window, or in a new window. Here, you can find the current error messages (displayed in red) along with other console level information such as warnings and info.
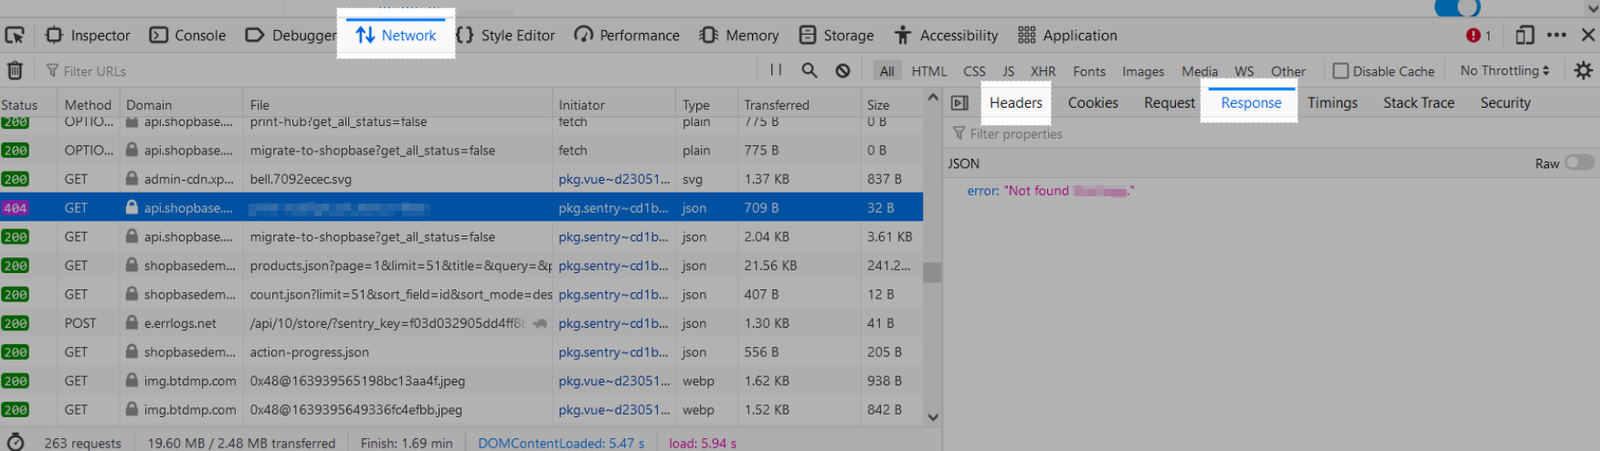
To open the Network logs, switch to Network tab and refresh the webpage. Errors are displayed in red.
Click on the error to find the error details. Navigate across Header and Response tabs to know more about the error and its origin. Please check with your designated support agent to determine which information to share.
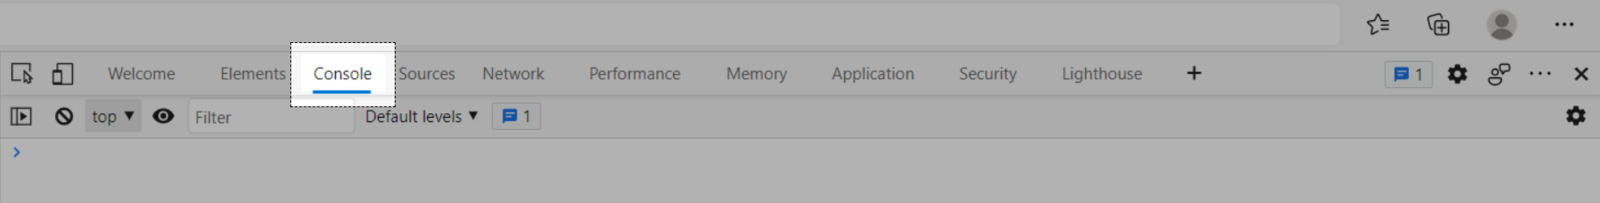
Microsoft Edge
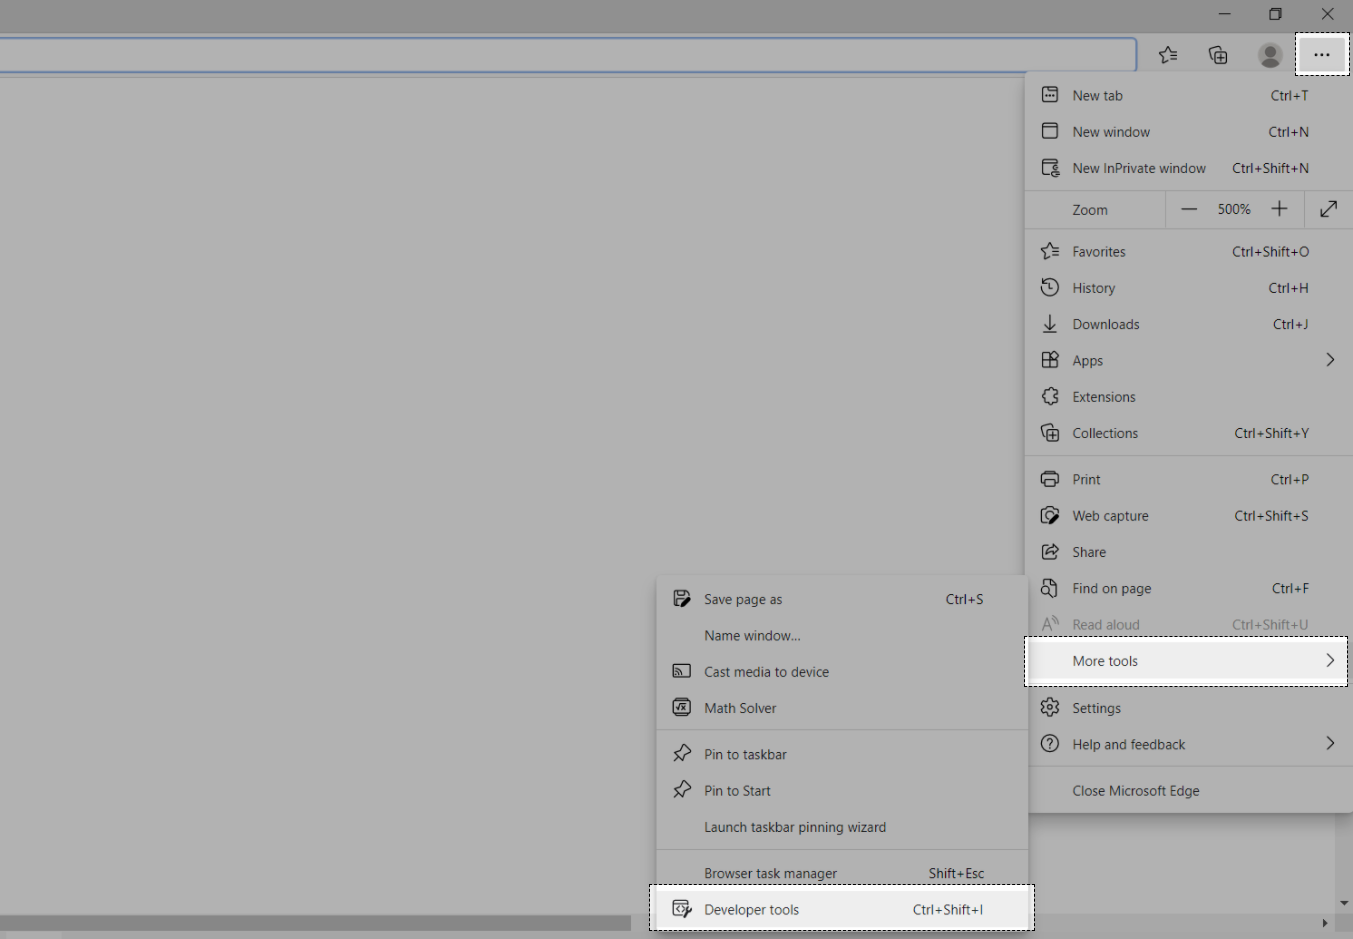
In Microsoft Edge, open the Edge Menu in the upper-right-hand corner of the browser window and select More Tools > Developer Tools. You can also use shortcut CTRL + Shift + I.
The console will either open up within your current Microsoft Edge window, or in a new window. Select Console tab. Here, you can find the current error messages (displayed in red) along with other console level information such as warnings and info.
To open the Network logs, switch to Network tab and refresh the webpage. Errors are displayed in red.
Click on the error to find the error details. Navigate across Header, Preview and Response tabs to know more about the error and its origin. Please check with your designated support agent to determine which information to share.

Updated about 1 year ago