This article will show you how to access your ShopBase Analytics dashboard. You can get an overview of the store's activities this way and adjust the business plan accordingly.
Step by Step Tutorial
From your ShopBase admin, go to Analytics > Analytics.
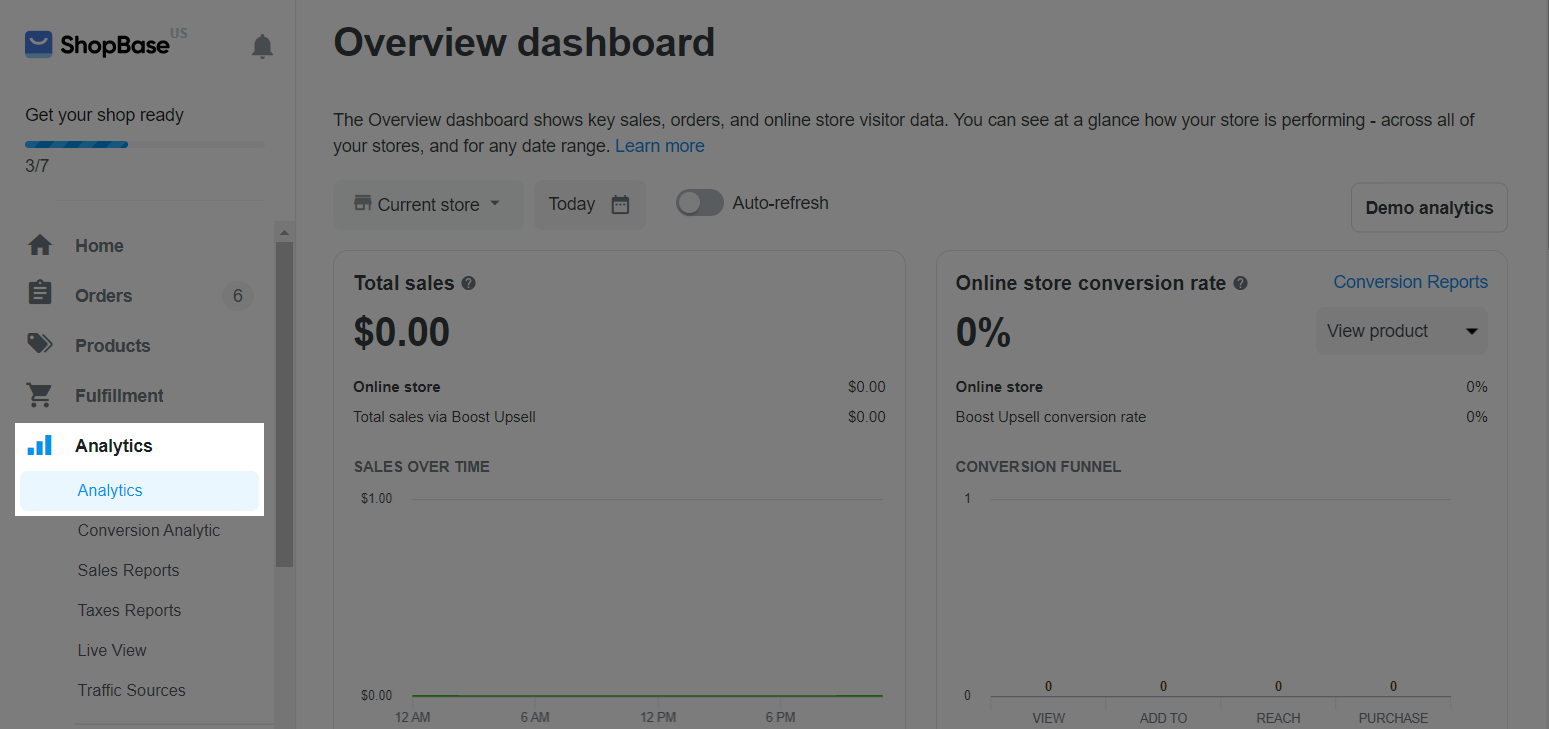
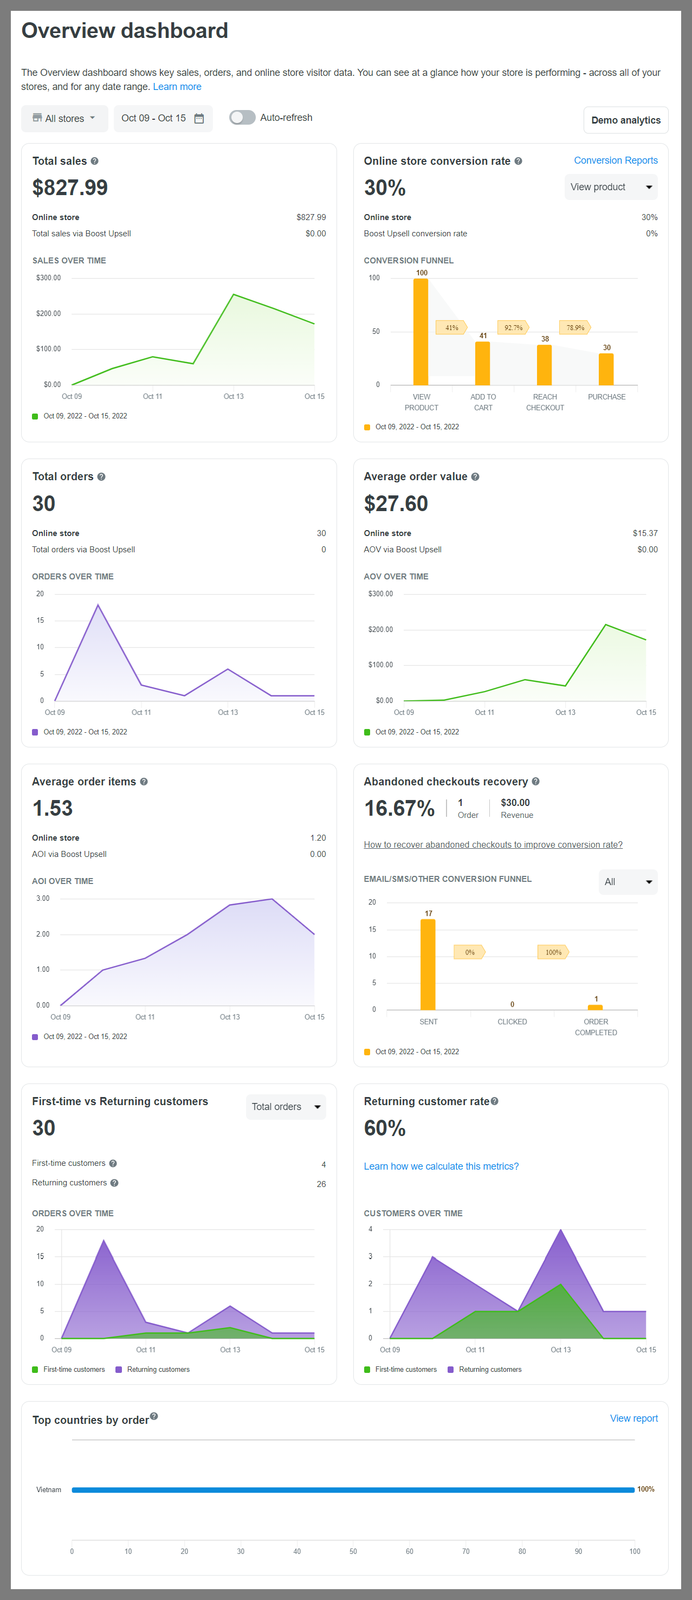
In Overview dashboard page, you can get access to analytics related to your store performance.
If your account has multiple stores, you can choose to see performance reports for all stores or individual stores by clicking Current store and ticking the checkboxes to select the stores you want to view analysis indicators in the drop-down menu.
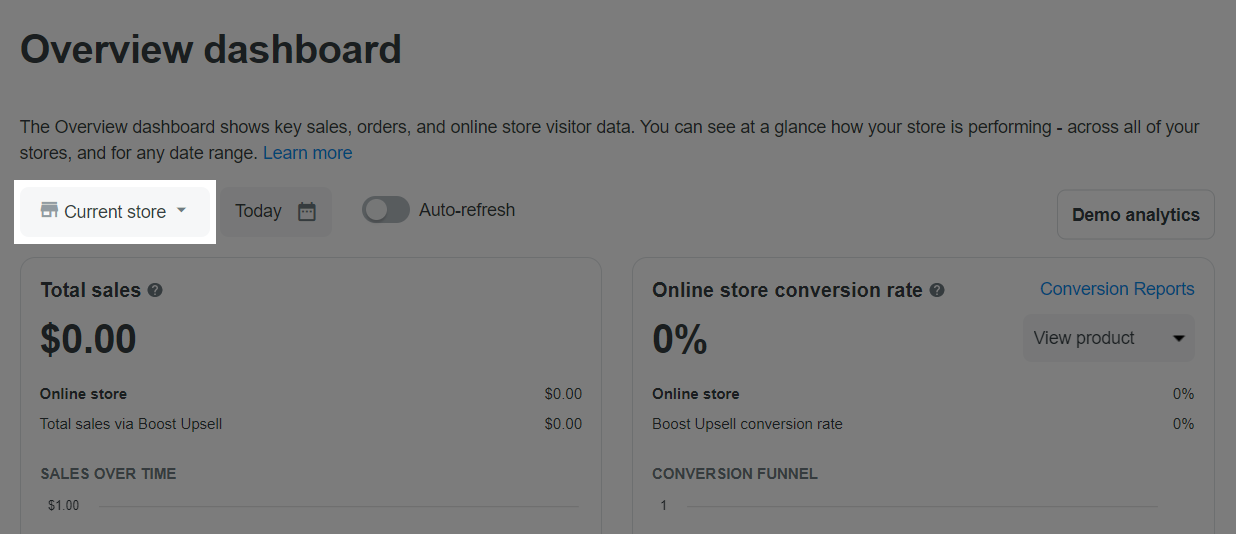
If you want your stores' statistics updated automatically, turn on Auto-fresh option for automatic update every 1 minute.
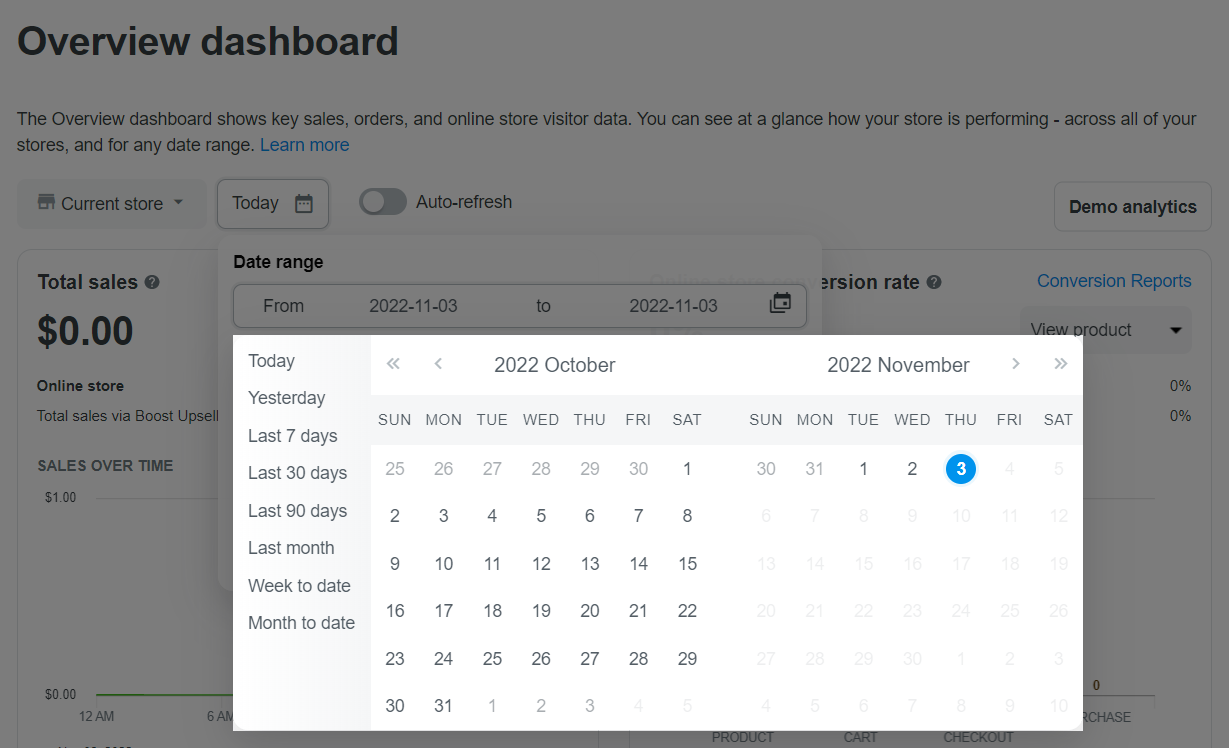
By default, the store analytics page shows today's data. If you want to see data of a different time period, click Today then click the date as shown below and choose a date range you want, such as last 7 days, or you can set the Custom time by clicking on the date on the calendar.
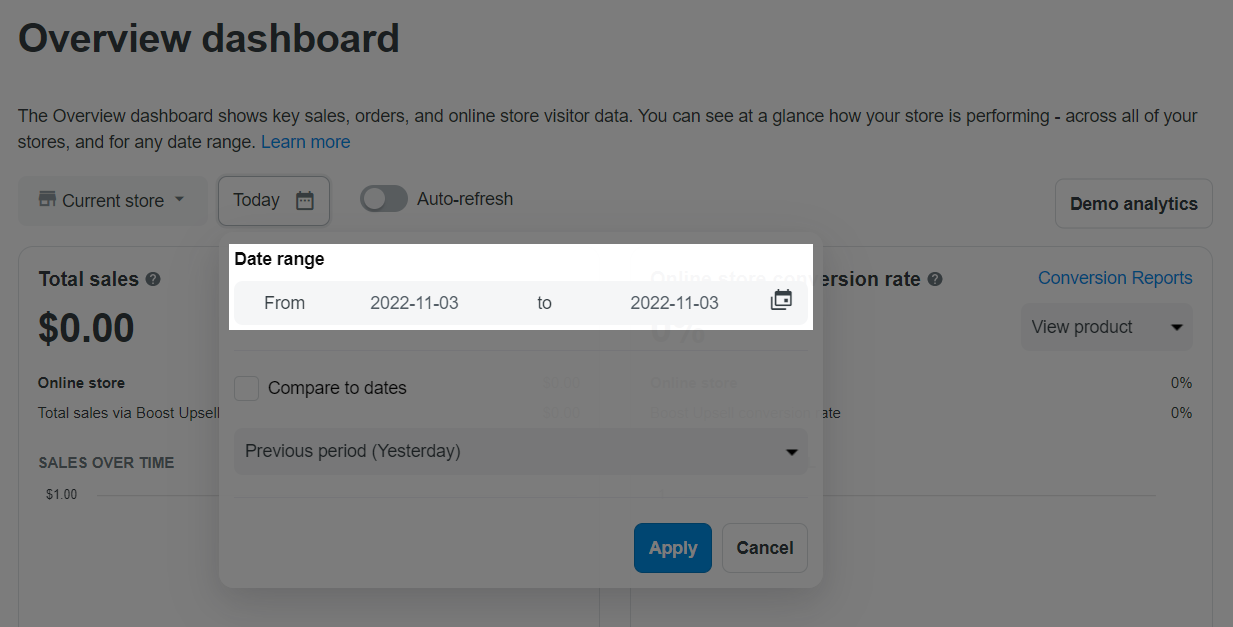
Then a dialog box appears and you can choose a time period to view the report in that dialog. Click Apply to complete selecting the time period to view the store's data analysis.
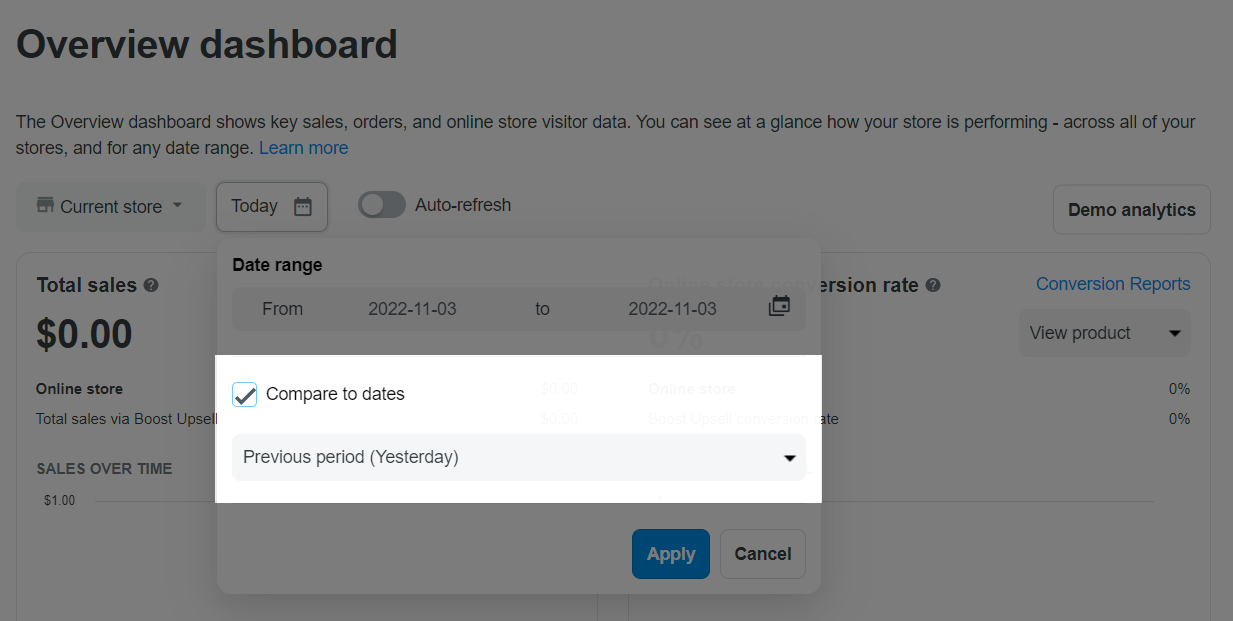
If you want to see comparisons with the previous period, check Compare to dates and choose the time period for comparison in the drop-down menu. Click Apply to complete.
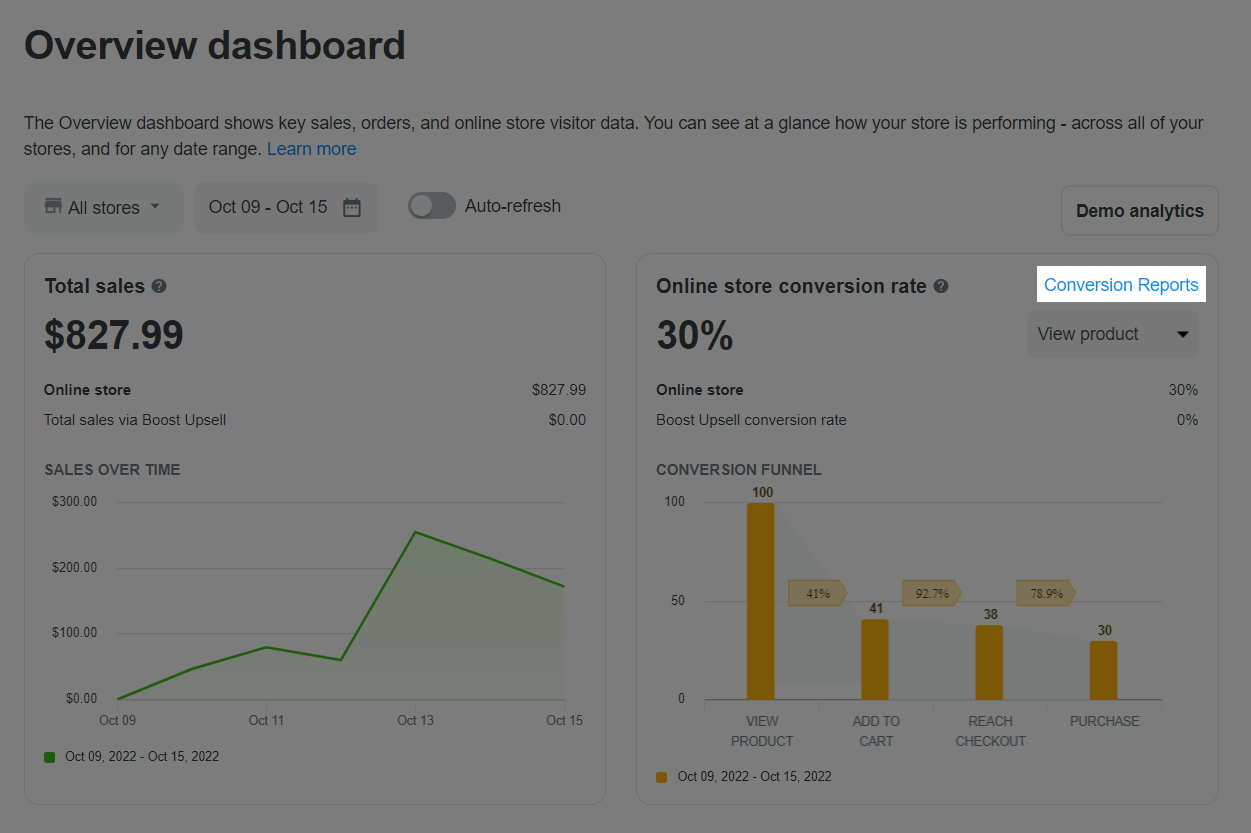
If the View report (or Conversion Reports for the Online store conversion rate report) option is shown, click it to have more details about the metric. Please note that not all metrics have a report.
Demo analytics can be viewed by clicking on Demo Analytics button. Data on this page is only for demo purposes.
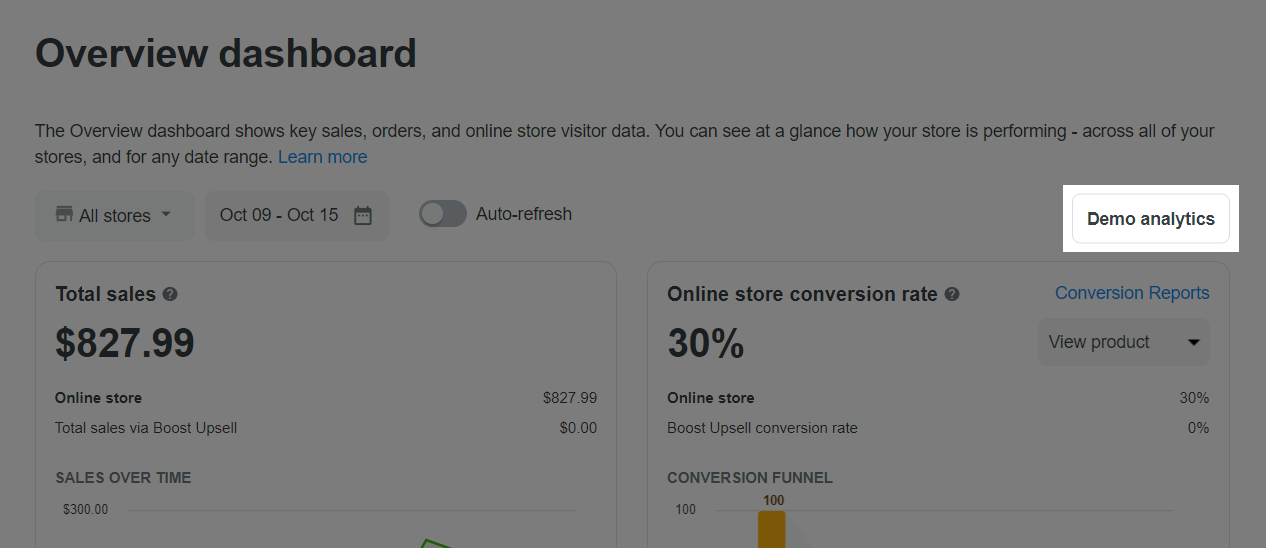
If your store already has orders (test orders are not included), the Demo Analytics button will not appear.
Check the analysis as below:
At the moment, only such data from September 01, 2021, to the present is reliable. Data prior to September 01, 2021, is still in the progress of migration.
Updated 8 months ago